TMEformer Tutorial
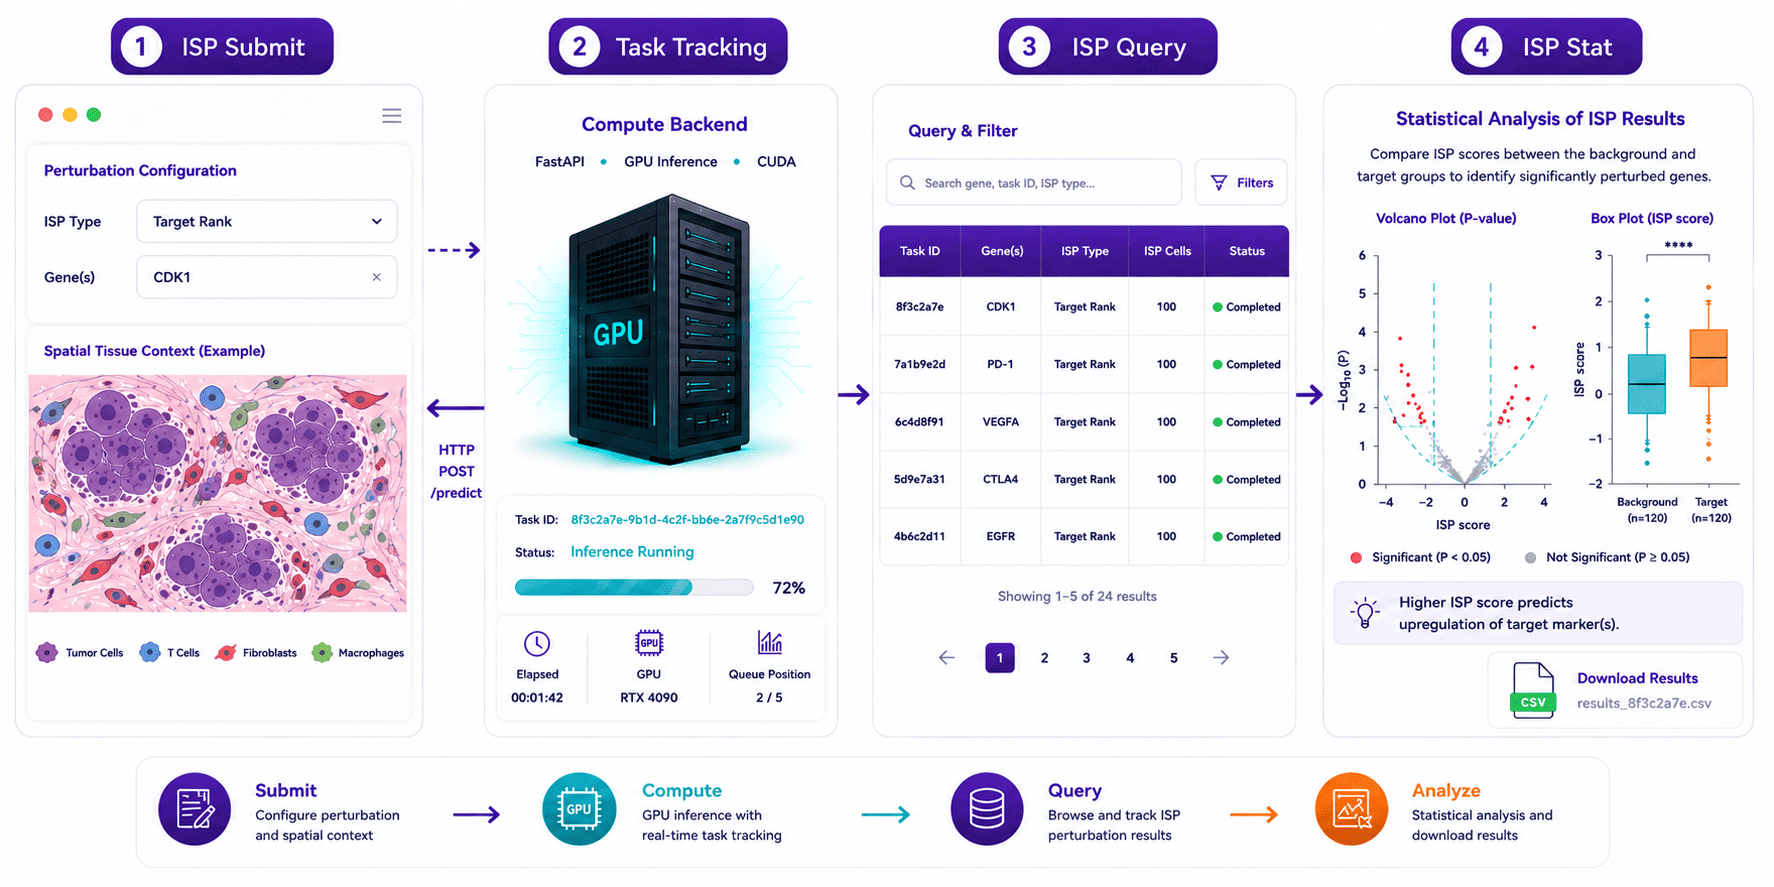
A step-by-step guide to using the TMEformer virtual perturbation platform. Follow the workflow below to submit perturbations, track tasks, and analyze results.
1. Platform Overview
What is TMEformer?
TMEformer is a virtual perturbation platform for spatial transcriptomics. It enables in silico perturbation predictions to identify potential key regulators in the tumor microenvironment (TME) without wet-lab experiments.
Architecture
  Your Browser  ──►  Server A (Web UI + Task Queue)  ──►  Server B (GPU Inference)
     (HTTP)            FastAPI + SQLite + Jinja2          FastAPI + TMEformer Model
                       Task Dispatcher                    GPU-accelerated Prediction
ISP Perturbation Types
| Type | What it does | Use case |
|---|---|---|
| Target Rank | Perturb tumor cells or their spatial TME context; predict tumor cell marker gene response | Identify key regulators in tumor cells |
| TME Composition | Adjust the proportion of a specific TME cell type (expand/delete); predict tumor cell marker gene response | Study how TME composition affects tumor cell expression |
| TME Rank | Perturb genes within a specific TME cell type; predict tumor cell marker gene response | Identify TME regulators that influence tumor behavior |
TME Cell Types
Epithelia (1) · T_lymph (2) · Myeloid (3) · Fibroblast (5) · Endothelial (6) · B_lymph (7) · Mast (8)
2. ISP Submit — Submit Perturbation Tasks
Step 1: Choose ISP Type
Select one of the three perturbation types from the dropdown. The form fields will update dynamically based on your selection.
Step 2: Select Model & Marker Set
Model: The trained TMEformer model to use for prediction (e.g., TMEformer).
Marker Set: The set of marker genes to evaluate (e.g., Marker50, NEPC4).
Step 3: Configure Perturbation Parameters
| Parameter | Target Rank | TME Composition | TME Rank |
|---|---|---|---|
Genes |
Select up to 3 genes to perturb (max 3) | Not applicable | Select 1 gene to perturb |
Cell Type |
Not applicable | Select target TME cell type | Select target TME cell type |
ISP Fold |
Not applicable | >1 = Expand, 0~1 = Delete, 0 = Delete all | Not applicable |
Fix Cell Types |
Not applicable | Optionally keep other cell types fixed during perturbation | Not applicable |
Number of Cells |
Number of cells to simulate (default: 100) | ||
Step 4: Submit
Click Submit Task. You will be redirected to the Task Tracking page where you can monitor progress in real time. Single gene = single mode; multiple genes = combination mode.
Smart Submit Features
- Duplicate Detection: Before submission, the system checks for existing tasks with identical parameters. If a completed result exists, you can analyze it directly without re-running. If a task is already running, you are notified to wait.
- Confirmation Overlay: A review panel shows a summary of all parameters before final submission. Action buttons adapt to duplicate status: "Analyze" + "Re-Submit" for completed duplicates, "Submit" for new tasks, "Close" for running duplicates.
- Live Perturbation Plan: A preview panel below the form updates in real time as you configure parameters, showing the ISP type description, selected genes/cell types, fold changes, simulation settings, and marker set details.
- Gene Limit: Maximum 3 genes can be selected. Once 3 genes are chosen, unselected genes are disabled in the dropdown.
3. ISP Query — Query Cached Results
When to Use
ISP Query retrieves previously computed results from the local cache. Use the Refresh button to sync the latest results from the inference server and update the local cache. This avoids re-running expensive GPU computations.
Parameters
| Parameter | Description |
|---|---|
ISP Type |
Target Rank / TME Composition / TME Rank |
Model ID |
Model name (e.g., TMEformer) |
Marker Set |
Gene set used (e.g., Marker50) |
After Query
If cached results are found, you can jump directly to ISP Stat for statistical analysis without submitting a new perturbation task.
ISP Data Overview
The query results page includes a visual summary: summary cards showing record counts per ISP type, a donut chart for record distribution, and a bar chart carousel (auto-rotating every 4s) displaying top genes or cell types per ISP type. TME Rank queries produce two separate charts (cell types and genes).
Browser Caching
Query results are automatically cached in your browser's localStorage with a 24-hour TTL. Revisiting the page restores your last query instantly. Click Refresh to bypass the cache and fetch fresh results from the server.
4. ISP Stat — Statistical Analysis
Overview
ISP Stat performs statistical analysis on perturbation results. It computes per-gene p-values using paired Wilcoxon tests and generates visualizations including volcano plots and distribution boxplots.
Pre-Flight Check
Before running analysis, click the Check button to verify that cached ISP results exist for your selected parameters. If matches are found, you'll see the count and a direct Analyze link. If no matches exist, the page will guide you to submit a perturbation task first.
Key Parameters
| Parameter | Options | Recommendation |
|---|---|---|
Score Type |
OE (Overexpression) / KD (Knockdown) | Auto-constrained: Target Rank = free; TME Rank = OE only; TME Composition = OE if Fold > 1, KD if Fold < 1 |
Score Method |
Area / Endpoint | Area for Target Rank; Endpoint for TME types |
Stat Level |
Patch / Sample / Cell | Patch (default) for spatial resolution |
Patch Size |
Numeric (default: 2000) | Match the patch size used in data processing |
Wilcoxon Test |
Less / Greater / Two-sided | Less (Target > Background) for most cases |
Result Page
The result page displays:
- Volcano Plot: -log10(p-value) vs. effect size for all tested genes, with PNG export
- Distribution Boxplots: Per-gene score distribution by group. Supports multi-marker selection via a custom gene picker — in "strict mode", only patches containing ALL selected markers in BOTH groups are included. Paired lines connect background/target scores across conditions.
- Significance Bar Chart: Gene count at p < 0.001, p < 0.05, p < 0.1, and not significant
- Expression Heatmap: Cell scores of significant genes across patches. Two interactive controls: "Top N Genes" (5/10/20/50) limits displayed genes, and "Score Group" (Target/Background/Target − Background) changes the color scale. Patches are sorted by average target score descending.
- P-value Table: Sorted table with p-values for each gene
- CSV Downloads: P-value Table, Score Table, and Significant Genes
- Re-analyze: Re-run analysis with a full-screen loading overlay; bypasses cache on force refresh
5. Task Tracking — Monitor GPU Inference
Task Lifecycle
  queued  ──►  running  ──►  success
    │              │
    │              └──►  failed
    │
    └──► cancelled (by user)
Features
- Real-time status: Auto-refreshes to show current task state
- Queued indicator: Queued tasks show "Waiting in queue..." with an animated pulsing dot
- GPU info: Shows which GPU is running your task
- Marker progress: Real-time count of completed, running, queued, and failed markers
- Estimated remaining time: Countdown display while the task is running (e.g., "5m 30s")
- Log viewer: Expandable log output from the inference process
- Inline actions: The task list table shows "Detail" and "Result" links for completed tasks, and a "Cancel" button for running/queued tasks — all directly in the row
- Cache Sync: Refresh button to sync the latest results from Server B to the local cache
After Completion
When a task reaches success, links to both the Task Detail page (tracking info, logs) and the Result page (raw perturbation data table) appear. Failed tasks show the error message for debugging.
6. Quick Start Workflow
Recommended Path for New Users
| # | Step | Page |
|---|---|---|
| 1 | Select a marker set and model on ISP Submit | ISP Submit |
| 2 | Choose perturbation type and configure parameters | ISP Submit |
| 3 | Submit task and monitor progress on Task Tracking | Task Tracking |
| 4 | Query cached results or go directly to ISP Stat | ISP Query / ISP Stat |
| 5 | Run statistical analysis, view plots, download CSV | ISP Stat |
Recommended Parameter Defaults
| Parameter | Recommended Value | Notes |
|---|---|---|
Number of Cells |
5000 | Form default is 100; 5000 recommended for production runs |
ISP Fold (TME Composition) |
2.0 | 2x expansion of target cell type |
Patch Size |
2000 | Match your data processing patch size |
Wilcoxon Test |
Less | Tests Target > Background |
Stat Level |
Patch | Preserves spatial information |